Create views and images for graphical visualization and control for eHouse system
Smart Home , intelligent Building eHouse allows you to create individual images to control the graphics and visualization to control home.
To create eHouse system configuration with application “ehouse.exe” :
- create the required devices (drivers) and giving them names
- assigning names to all outputs , inputs , measurement inputs in the application eHouse
- create a configuration to control the text from a Web browser , FTP , and mobile phones and panels “ehouse.exe /mobile”
Then you should export the settings for Corel Draw ( min VERSION 12) to create objects for graphical visualization and control , and complete images (views) .
This is done by running the application with a parameter “/cdr” – “ehouse.exe /cdr” .
The Corel Draw application is well known by users and with the support of macros , Visual Basic Script is suitable for this purpose perfectly.
The Corel Draw application – 30 day demo version can be downloaded from the manufacturer webpage.
For the purposes of eHouse system has been developed the necessary software in Visual Basic allow:
- import names , events in a text file generated from the application eHouse
- Document creation of an appropriate size for the home ( real dimensions in meters)
- create a building footprint , architectural plan ( room) , objects allowing for accurate sizing and scaling ( giving the coordinates )
- manually create objects in a document
- export configuration files ( text ) for different methods of visualization and graphical control :
- Visualization and graphical control Windows XP , Vista , 6 – For PC , Pads , touch panels are compatible with PC .
- Visualization and graphical control Java – For PC , Pads , touch panels are compatible with PC .
- visualization and graphical control Windows Mobile – for PDA , Touch panels , mobile phones , TouchPhones , SmartPhones etc, Pads..
- visualization and graphical control Android – for PDA , Touch panels , mobile phones , TouchPhones , SmartPhones etc, Pads..
- For a web browser in several ways (to whatever you can control your system from different types of devices , web browsers , the operating system :
- HTML + Maps + background image
- XML + SVG
- SVG + Java Script for compression and visualization
Creating a view is based on:
- copy blank template available in the installation directory should give it name of future view such Ground , attic , plot
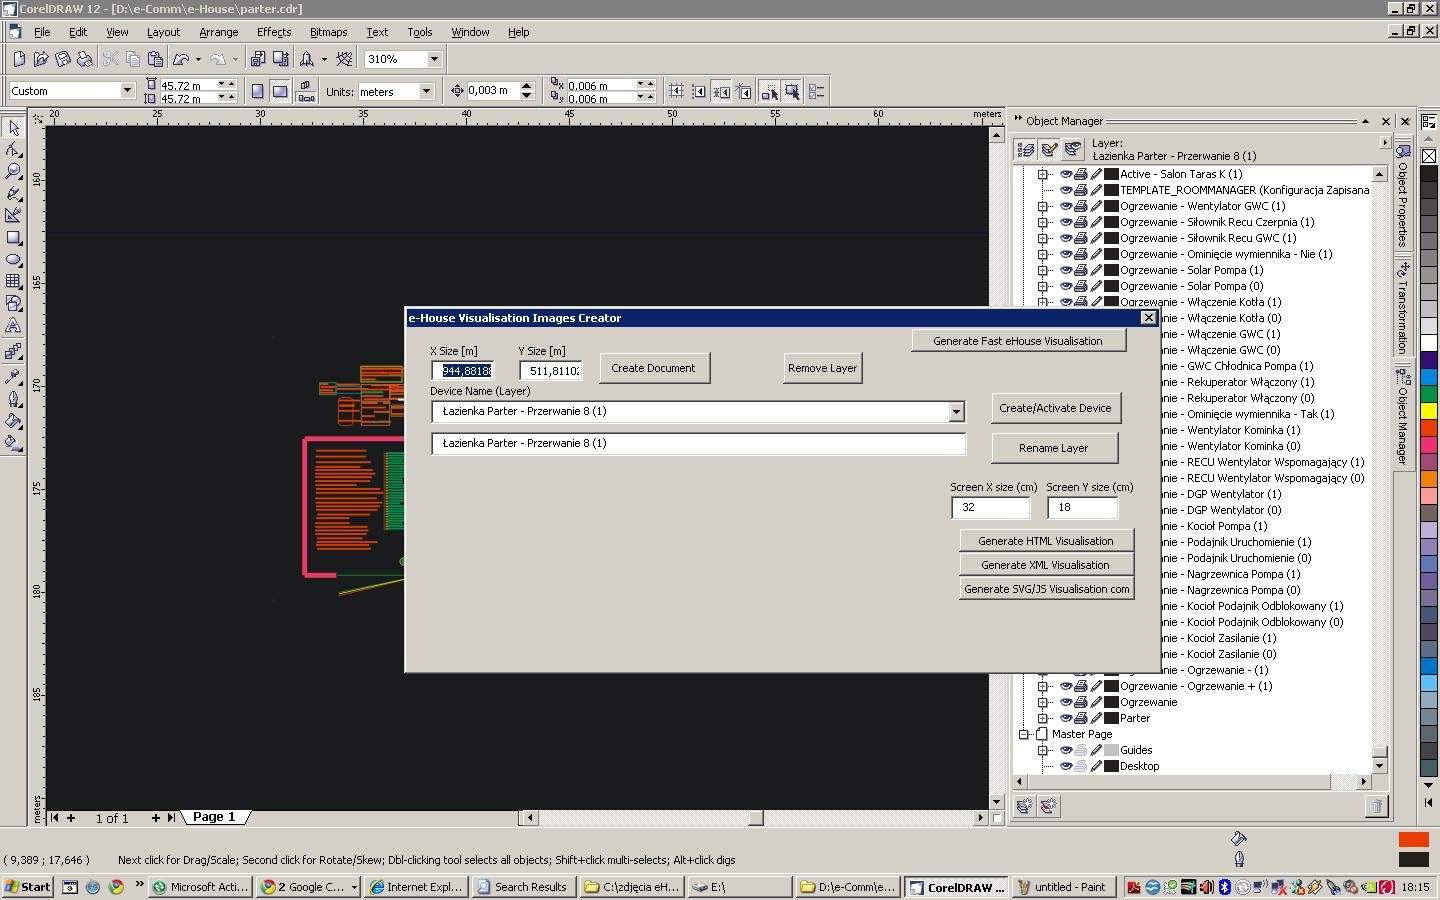
- run the macro to create objects (detailed description is given in documentation smart home eHouse point 4.11)
- create a document by entering the dimensions in meters and press the “create document” which automatically creates layers with names related to the names in the system eHouse
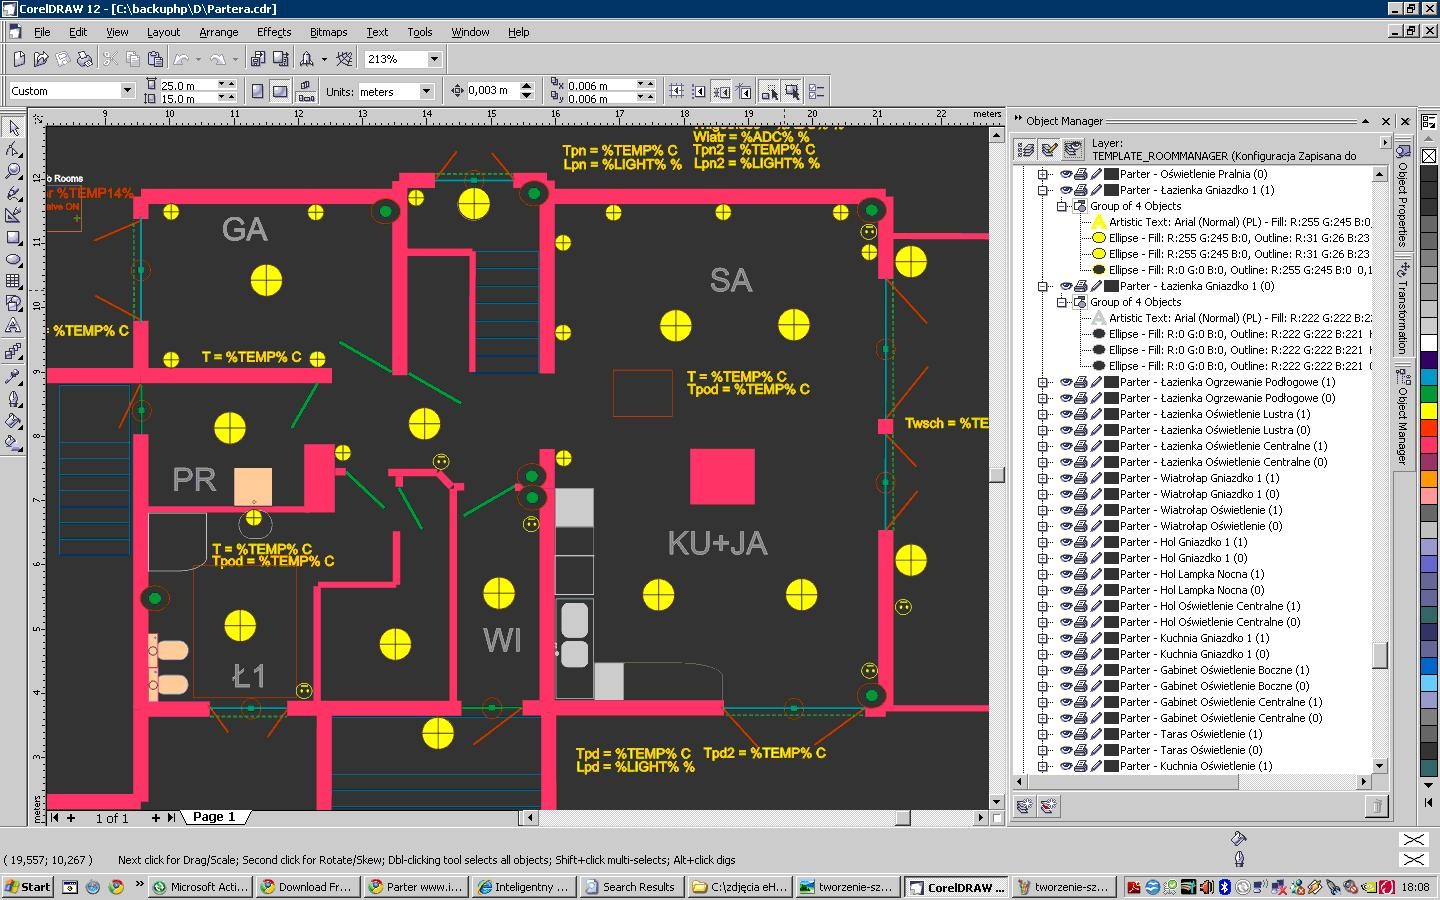
- using macros to put the outline of the building and the walls giving the coordinates of the points
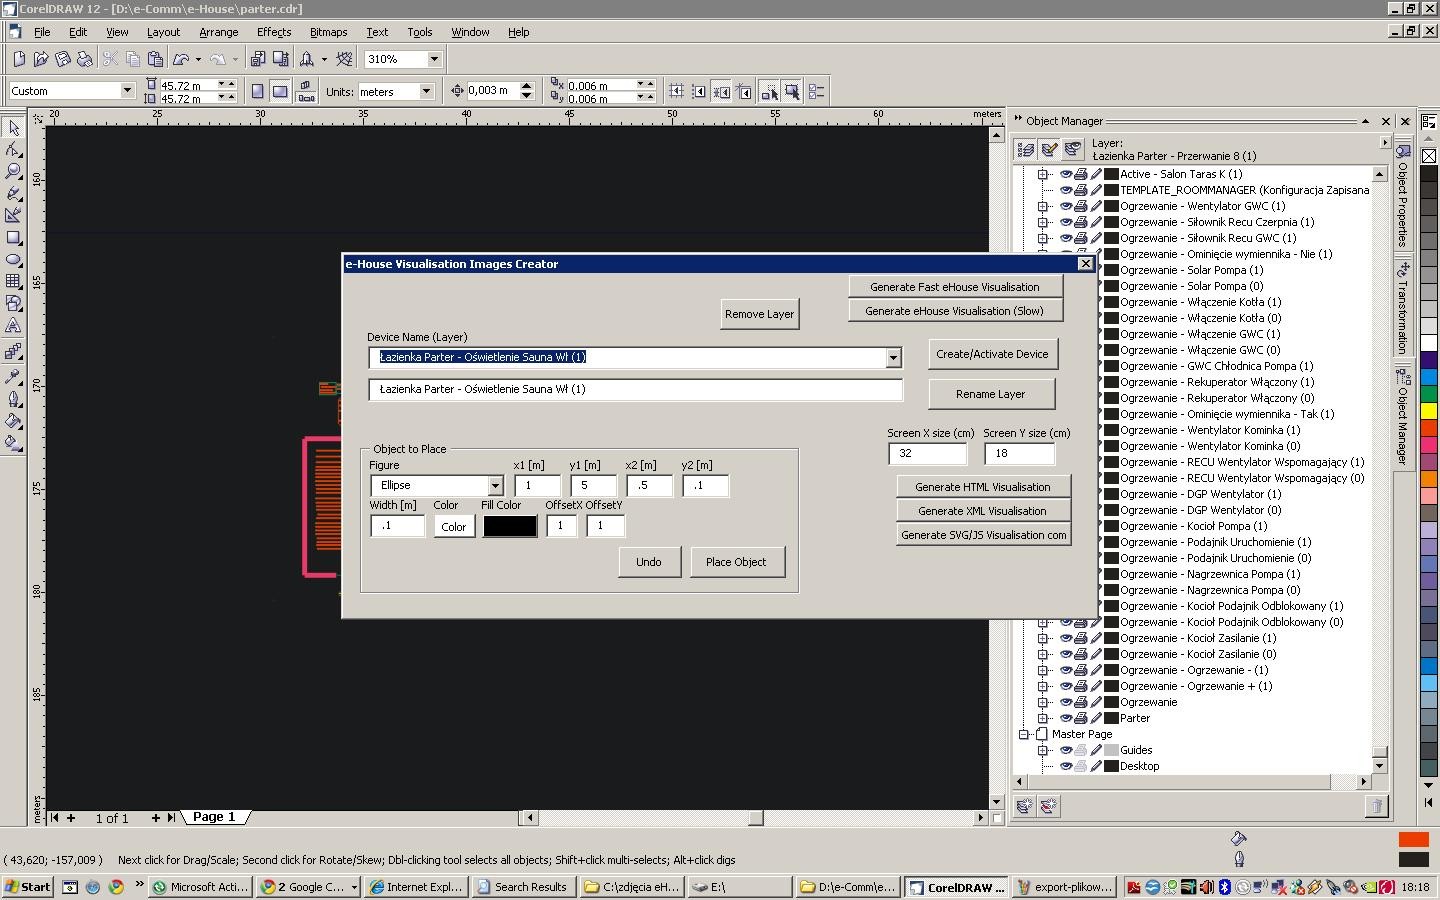
- layers associated with certain eHouse events , outputs , inputs place objects , which will then appear on the visualization
- create a configuration for each method of visualization
It should be in the parameters of the macro to enter the dimensions of the target control panel ( in centimeters ) and press the button corresponding to the method of visualization and graphical control .
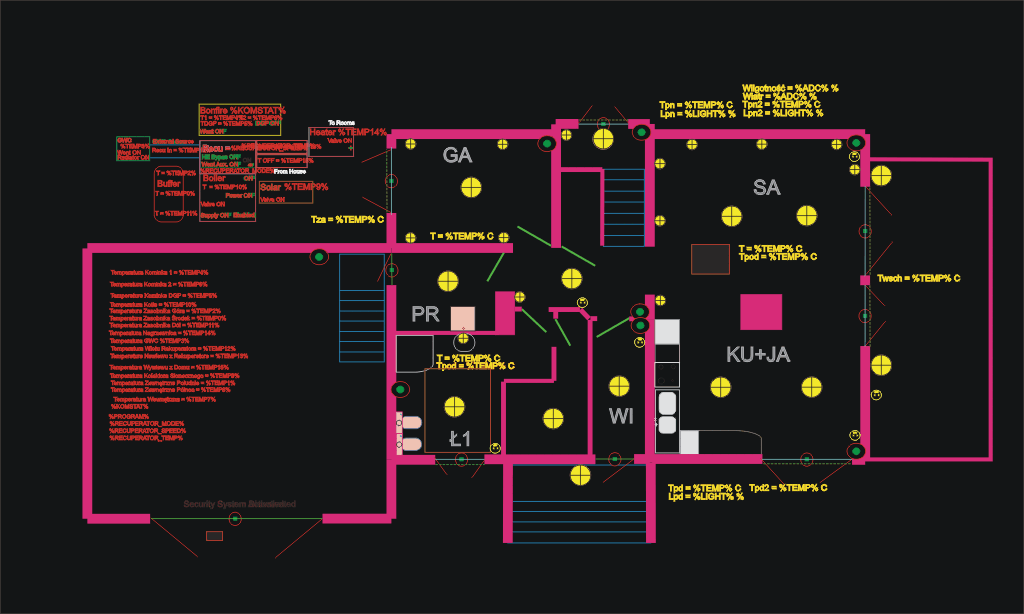
The final result of the project demo with dynamic fields replaced is the measurement data the first to know by the visualization software .
 Visual effects in a variety of graphical control methods are presented in the gallery to visualize differences .
Gallery of images – eHouse Smart House – graphic control and visualization based on the demonstration project


