smart home eHouse graphical visualization and control. Creating visualization.
The latest version of scripts to create individual graphic visualization and control for eHouse graphics software and Web Browser.
In the most current version of script capabilities to create individual graphic visualization and control it includes:
- Automatic import of names: devices, events, signals of eHouse variants: eHouse.Pro, Ethernet eHouse (LAN), eHouse 1 (RS-485) eHouse4CAN (into independent layers)
- Automatic update of changes – names, events, system events
- Automatic cleaning of empty layers – without visualization objects
- Manually add new devices, layers, or a change in case of change of name
- Precision manual creation of graphical objects (by entering the coordinates and parameters)
- Create template images, export, import options for creating views, the outline of the building, repeating objects, etc.
- Automatic creation views of objects from image templates for inputs, outputs, alarms
- Support shapes: line, circle, ellipse, polygon, rectangle, rounded rectangle
- Create a visualization to control applications on any eHouse platform (Android, Java, Windows, Linux)
- Create multiple variants of graphical visualization and control for web browsers allowing usage of any browser on any operating systems and devices: SVG, XML, HTML, SVG + JavaScript, Maps HTML, HTML Form, Custom (individually created based on templates created their own )
- Create a visualization dedicated to any hardware panels – any screen size (which is a parameter in centimeters)
- Create a visualization dedicated to any hardware panels – any screen size (which is a parameter in pixels)
Due to the large number of changes, interface changes comparing to previous version – we describe it from the beginning.
In order to utilize the functionality of macros, open a blank template file “*.CDR” and select “Enable Macro” allowing usage VBA scripting.
Then select the menu Tools-> Macros-> Run Macros-> eHouseVis.
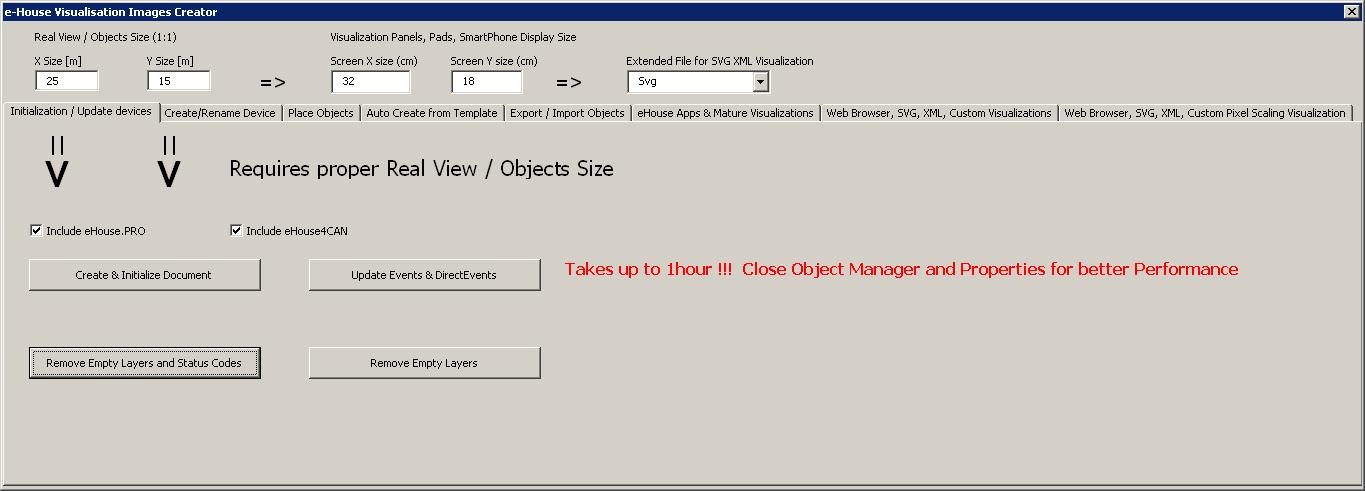
Creating Visualization – Initialization
- To create and initialize objects “Object Manager” must be completely closed which will accelerate the formation of thousands layers, objects
- In “X Size [m]”, “Y Size [m]”, enter the actual dimensions of the view in meters.
- setting “Include eHouse.PRO” flag allows you to add eHouse.PRO intelligent home system configuration for visualization
- setting “Include eHouse4CAN” flag allows you to add eHouse4CAN smart home system configuration for visualization
- Then press the “Create & Initialize Document” which will automatically create all the objects eHouse system. This can take up to one hour because the system can have many thousands of objects
On this form there are also buttons:
- “Remove Empty Layers” – remove empty layers without graphical objects
- “Remove Empty Layers and Status Codes” – remove empty layers without any graphics and event codes of eHouse system
- “Update Events & DirectEvents” – update eHouse control codes for all graphic objects created. Upon completion of visualization
Manually creating visualization objects
Another form allows you to manually create new layers and change their names (for events):
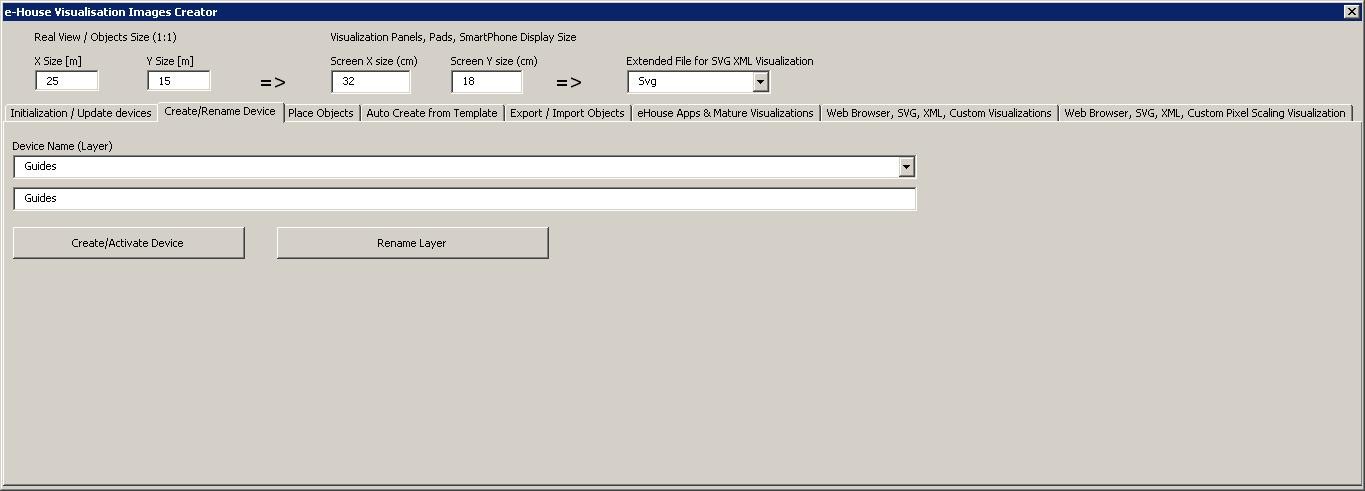
- “Create / Activate device” – creating a new layer. The name entered in the edit box, and then presses the button above
- “Rename Layer” – Change the name of the layer. In the “Device Name (Layer)” to select the layer. Then, in the edit box and then change the description presses the button above
Automatic creation of graphical objects from templates
Repetitive graphical objects can be created from pre-defined templates for layers with names containing ‘TEMPLATE_”.
Individual templates are on layers with the addition of:
For each alarm entry (on/off)
- “TEMPLATE_Active” – for active inputs
- “TEMPLATE_Alarm” – for alarm signal
- “TEMPLATE_Warning” – for warning signals
- “TEMPLATE_Monitoring” – for signal monitoring
- “TEMPLATE_Horn” – for siren signals
- “TEMPLATE_Silent” – for silent alarm signals
- “TEMPLATE_Early” – for early warning
- “TEMPLATE_SMS” – for signals SMS
- “TEMPLATE_Input” – for input signals
For other signals:
- “TEMPLATE_OUT” – for digital outputs
- “TEMPLATE_PROGRAM” – for outputs programs
- “TEMPLATE_ZONES” – for security zones
- “TEMPLATE_SECUPROGRAMS” – for security programs/drives
- “TEMPLATE_ADCPROGRAMS” – for programs regulating/measurement
Form “Auto Create from Template” contains the necessary elements for the automatic creation of graphical objects such as inputs/alarms, outputs, buttons, programs, etc.
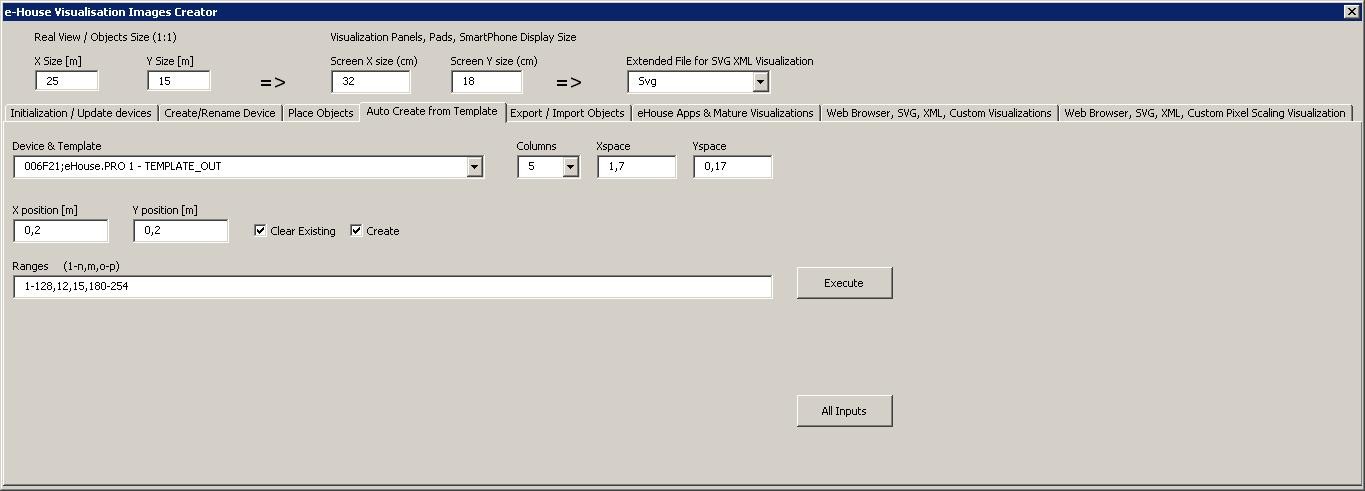
- in the “Device & Template” field – select the appropriate template
- in the “Column” field – is the number of objects in each row
- in the “X space” field – is located in the X-axis spacing between successive objects
- in the “Y space” field – is located in the Y-axis interval between successive rows
- “Clear Existing” – allows the removal of layers of graphics in which the templates are copied
- “Create” – allows you to create graphic elements of the template
- Edit box “Ranges” – contains a list of items that will be processed during the creation, deletion of graphical objects. It is permissible to calculate the elements separated by a comma “,” or ranges separated by a semicolon “-” eg “1-12,15,17,21-32,38-45”
- “Execute” – start the creation of graphical objects for the selected template from the list of “Device & Template”
- “All Inputs” – launches the creation of facilities for all input signals / alarms
Exporting/Importing graphics objects
Export/Import allows you to easily and quickly copy portions of visualization to create different variants, views, such as a separate for children by limiting their functionality. Export/import fully copies the graphic objects with layers and their location. To perform the export should be noted in the image (choose – “Select” button while holding down the Shift to add more or select all and copy then delete unwanted) objects to copy.
Then, in the “File name” enter the name of the export file that will be created in the “XML/exports/” with the extension “.CDR” and will be in “Corel Draw” format.
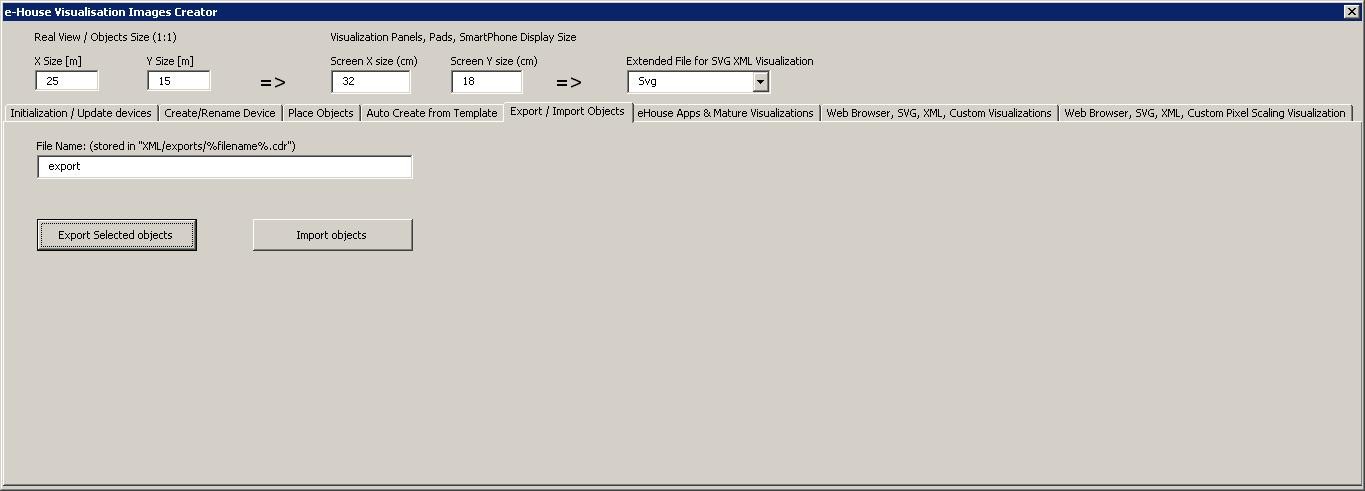
- “File Name” – the name of the file export/import without extension
- “Export Selected Objects” – export selected graphic elements and layers
- “Import Objects” – import graphic elements and layers of exports
Creating Application Visualization for eHouse System panels
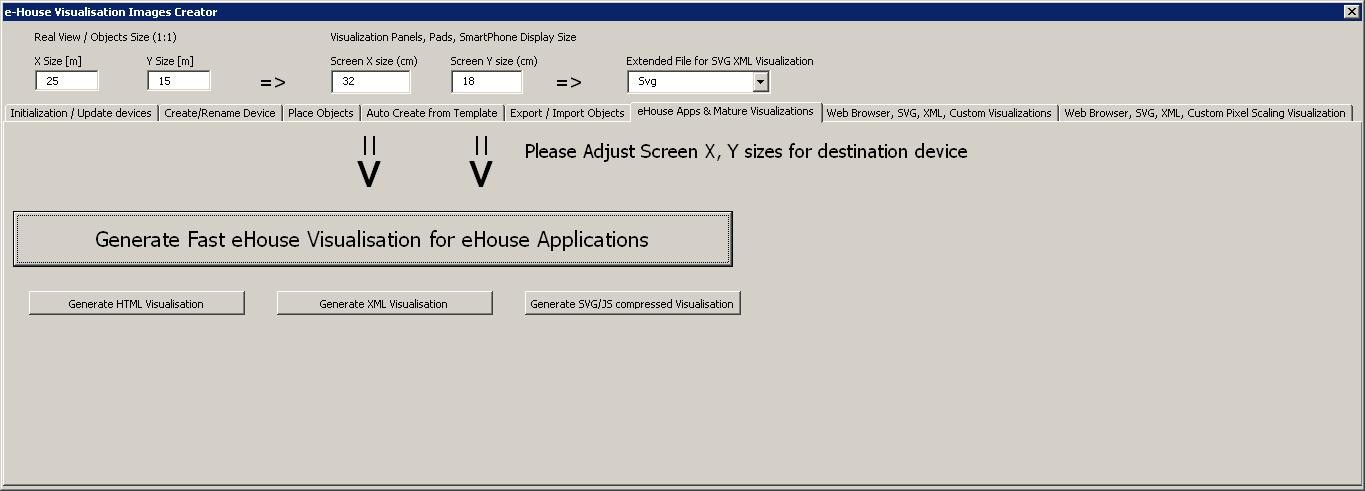
This form allows you to generate a file ready for eHouse visualization and control native applications for:
- Java – Any platforms and operating systems with the Java virtual machine
- Android – any hardware running android smartphones, PADs, SmartTV
- Windows mobile, phone, .Net, .Net CF
To generate a visualization for any eHouse panels:
- enter the dimensions of the display panel in centimeters in the fields: “X Screen size”, “Y Screen size”
- Press “Generate fast eHouse Visualization for eHouse Applications”
- For the older methods of controlling the graphics for web browsers can generate images
- Maps HTML – “Generate HTML Visualization”
- XML/SVG – “Generate XML Visualization”
- SVG compressed with Javascript – “Generate SVG/JS compressed Visualization”
For different panels/displays/screens sizes to be generated independently by changing the size (scale to fill up screen) of the visualization screens and pressing the creation of visualization. After generating the views of data must be moved to another location or change the name that has not been overwritten with new settings, because the visualization is always created with the same name as corel draw (.cdr) file name.
Visualization files: html form, svg, xml is stored in the “XML/” with the appropriate extension.
Visualization files for eHouse application form root directory where the current file CDR
Creating graphical visualization and control of Web browsers for panels with programmable screen size in centimeters
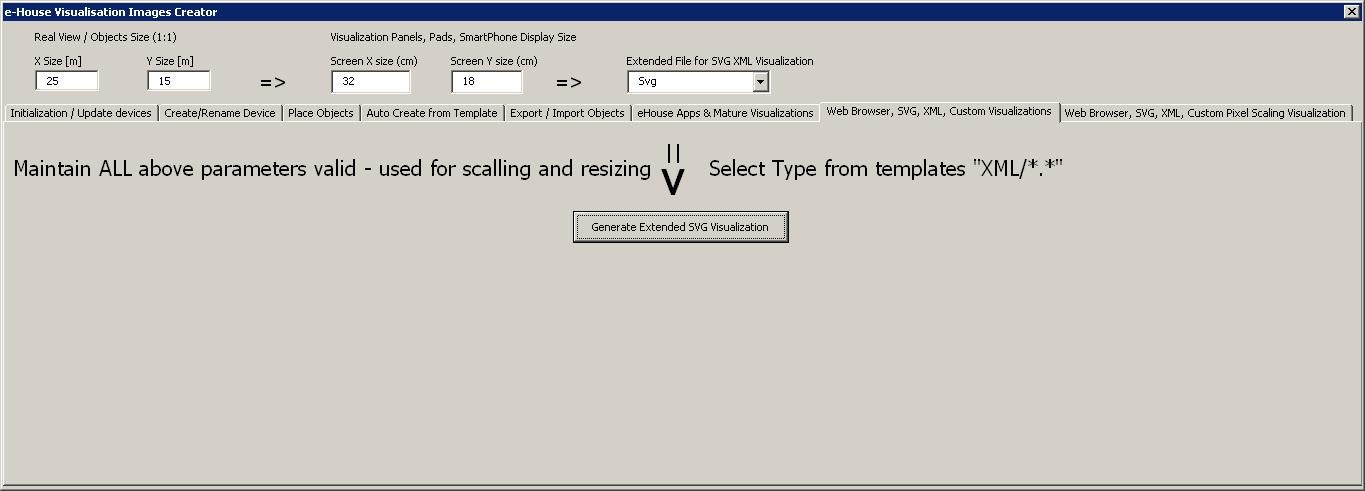
This form allows you to generate complete files, exports for graphical visualization and control for Web browsers, third party applications:
- SVG/JS – Visualization and graphic control + JS compression
- XML/SVG – Visualization and graphic control without compression JS
- Custom format export – based on individually created template
- Ability to add new individual export formats of visualization objects
To generate a visualization for any eHouse panels include:
- check the dimensions in meters in the fields: “X Size [m]”, “Y Size [m]”
- enter the dimensions of the display panel in centimeters in the fields: “X Screen size”, “Y Screen size”
- Select the export format in the “Extended SVG XML Visualization”
- XML – SVG/XML
- SVG – SVG compression JavaScript
- Custom format
- You can add your own files to create the templates in the “XML /”
- Press “Generate Extended SVG Visualization”
For different panels/displays/screens to be generated independently by changing the size (scaling for optimal fill up of screen) of the visualization screens and pressing “create visualization”. After generating data, views file must be immediately moved to another location or change the name that has not been overwritten with new settings, because the visualization is always created with the same name as corel draw file name.
Visualization files form html, svg, xml in the “XML /” with the appropriate extension.
Creating graphical visualization and control for Web browsers based panels with programmable screen size in pixels
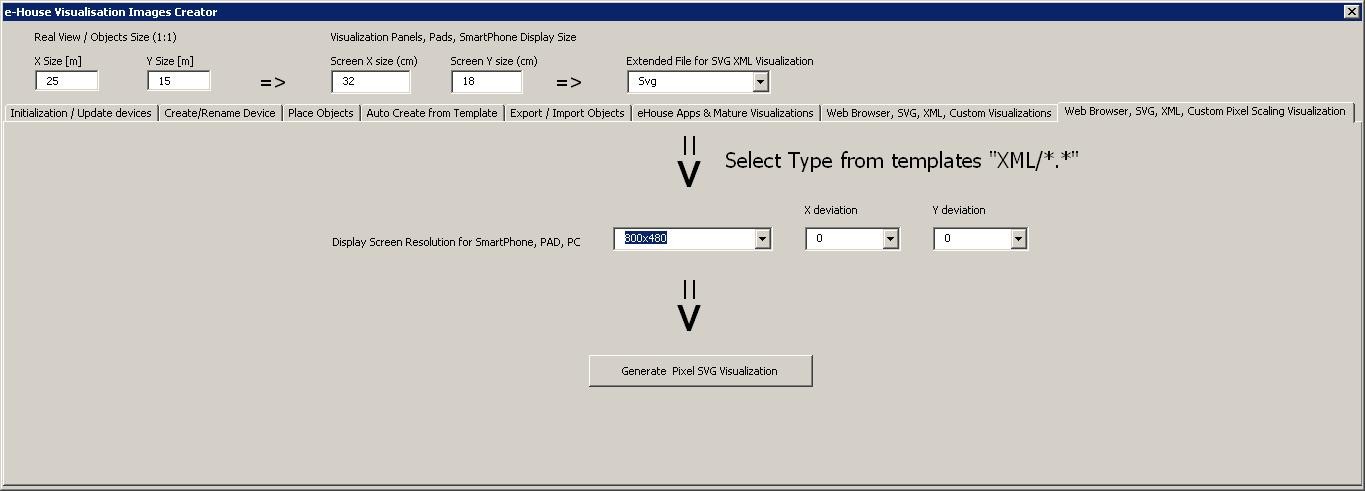
This form allows you to generate the finished files for graphical visualization and control for Web browsers:
- SVG / JS – Visualization and graphic control + JS compression
- XML / SVG – Visualization and graphic control without compression JS
- Custom format – individually created template
- Ability to add new individual export formats of visualization objects
To generate a visualization for any eHouse panels include:
- check the dimensions in meters in the fields: “X Size [m]”, “Y Size [m]”
- Select the resolution in pixels of the display panel in the “Display Screen Resolution”
- Optional screen making it possible to reduce the margin in the fields: “X deviation”, “Y deviation” for both axis
- Select the export format in the “Extended SVG XML Visualization”
- XML – SVG/XML
- SVG – SVG compression JavaScript
- Custom Format
- You can add your own configuration files to create the templates in the “XML/”
- Press the “Generate Extended SVG Visualization”
For different panels/displays/screens, generate visualization, regardless changing the size of the screen and pressing the creation of visualization. After generating the views of data must be moved to another location or change the name that has not been overwritten with new settings, because the visualization is always created with the same name as the file name corel draw.
Visualization files: html , svg, xml in the “XML /” with the appropriate extension.
Manual, Precision creation of graphical objects
It is possible to precisely draw simple figures available and accepted by eHouse software, which was specifically discussed in earlier posts.
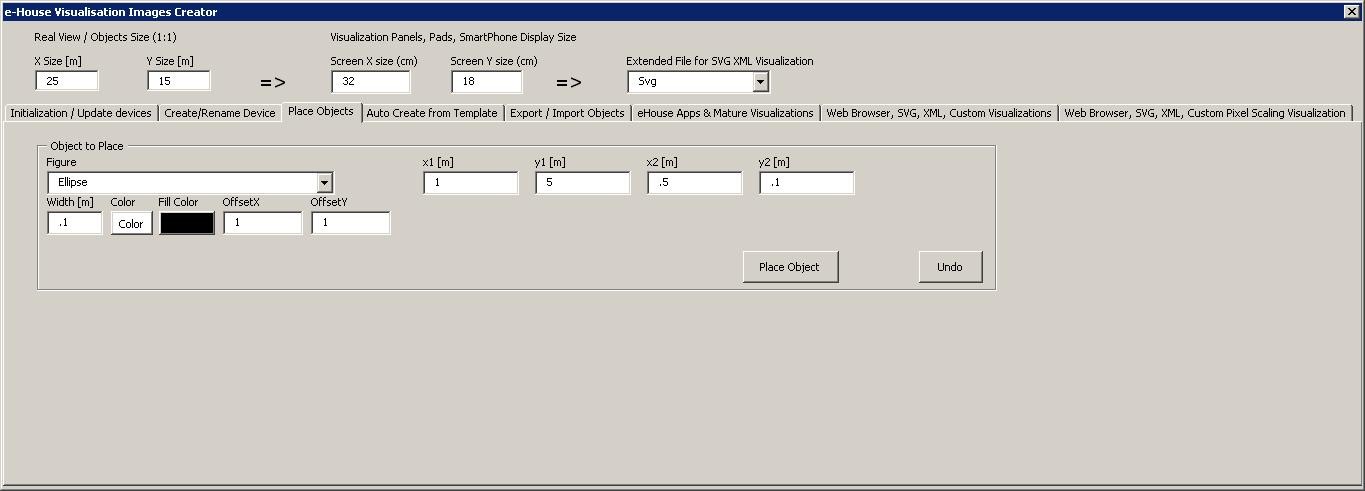
To create a figure on the current layer (active) to:
- Select the figure (shape) in the field: “Figure”
- enter the points (x1, y1), (x2, y2) coordinates
- select the thickness of the line – “Width [m]”
- Select the color of the line – “Color”
- Select the fill color – “Fill Color”
- enter “X Offset”, “Y Offset” for each axis
- Press “Place Object”
- In the case of wrong place, you can press the “Undo”
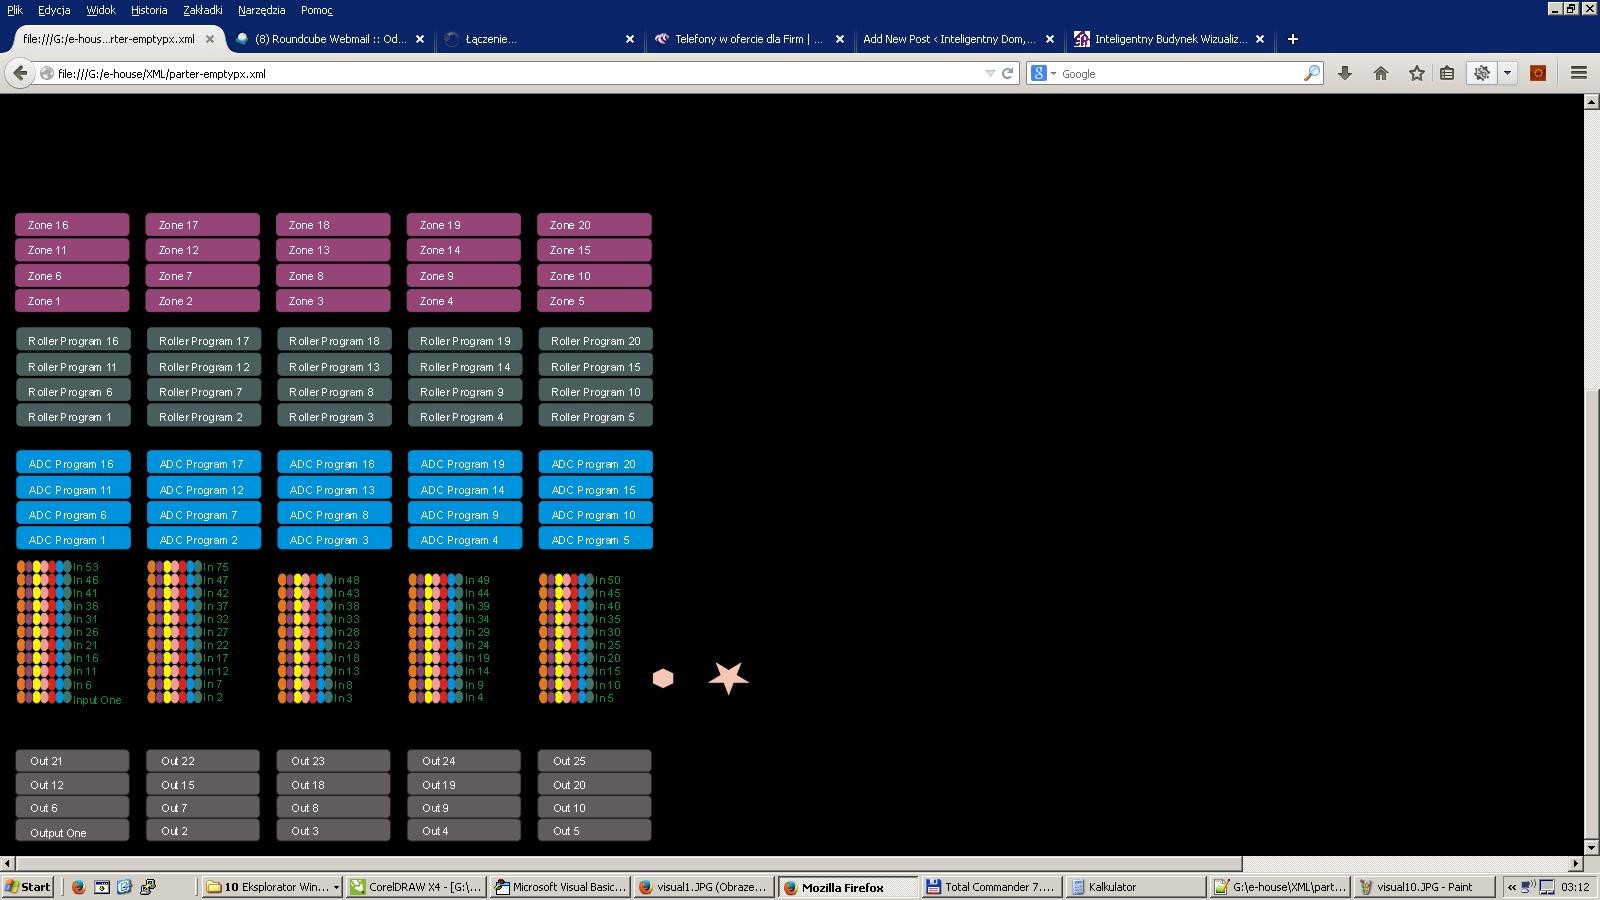
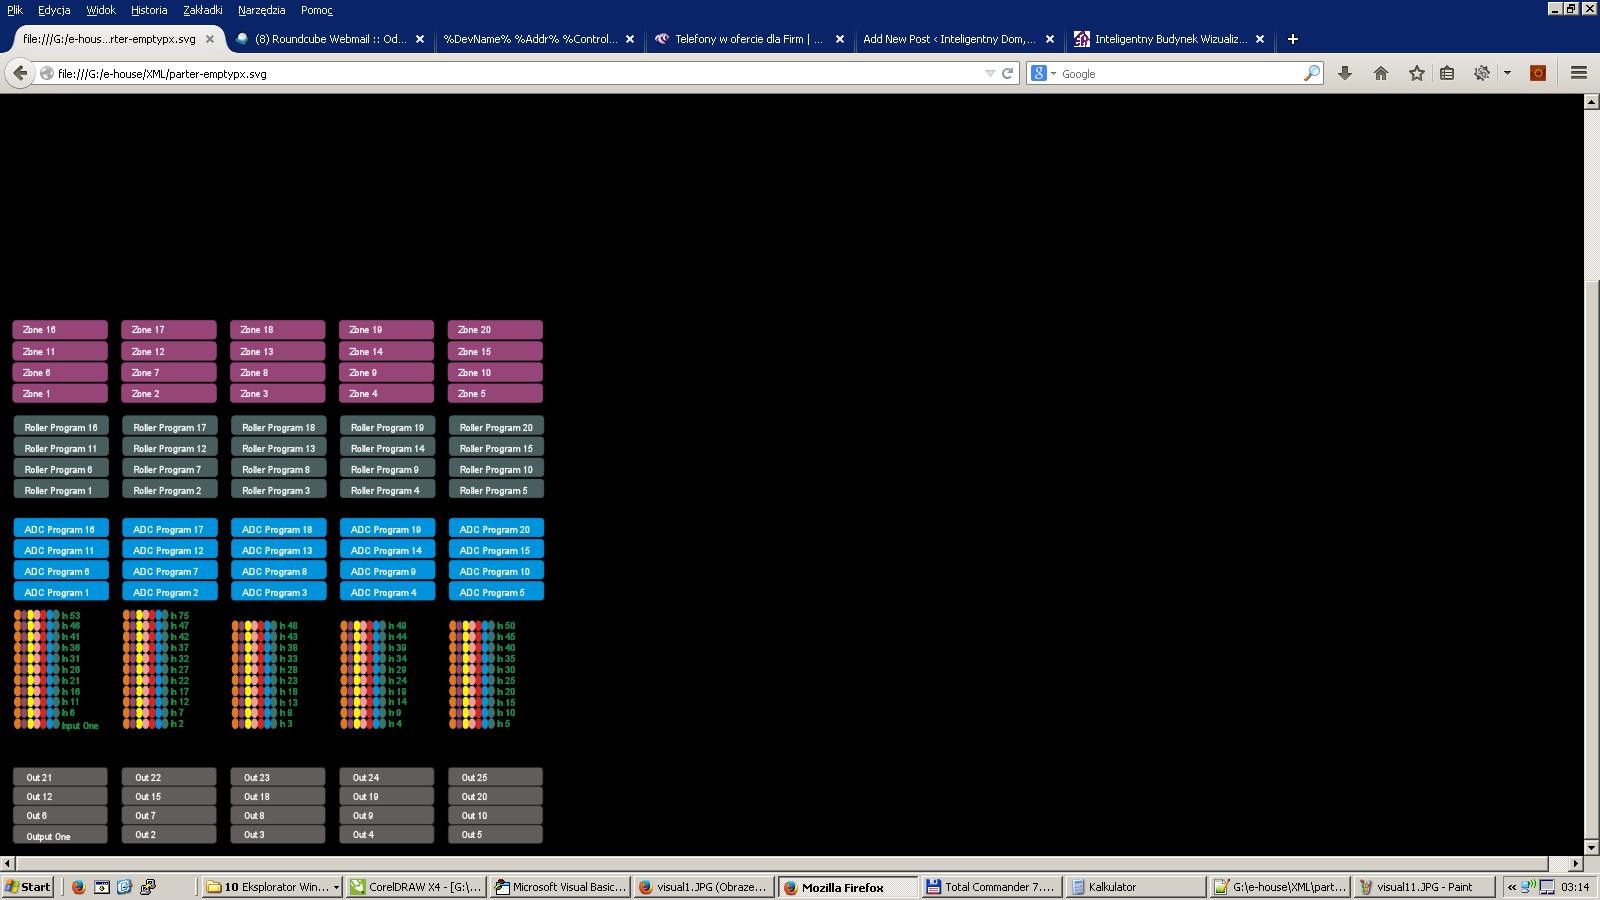
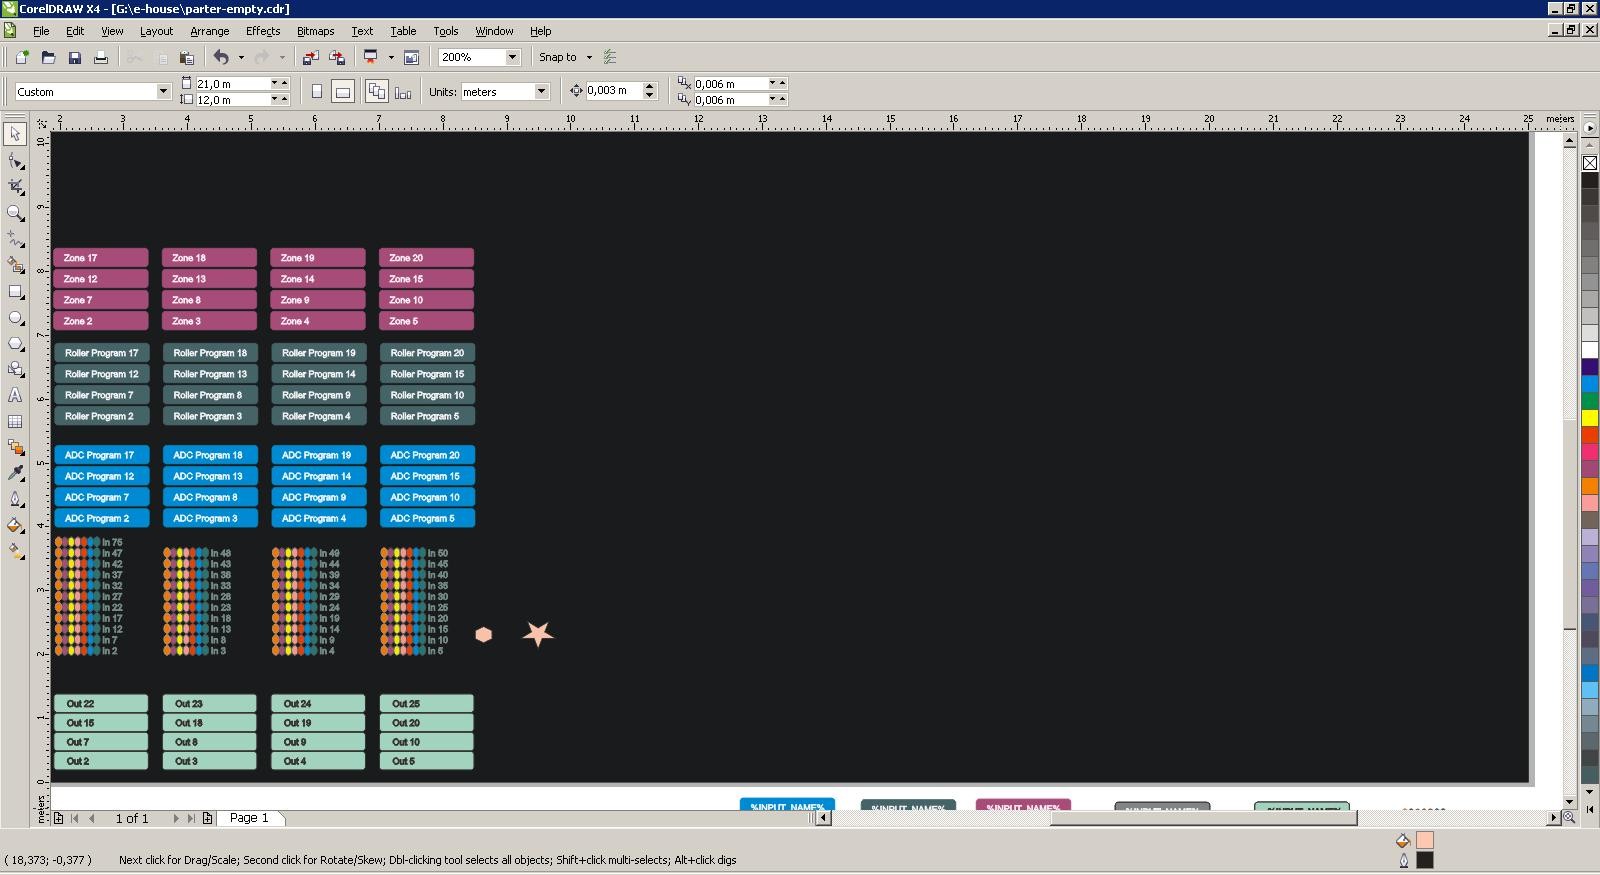
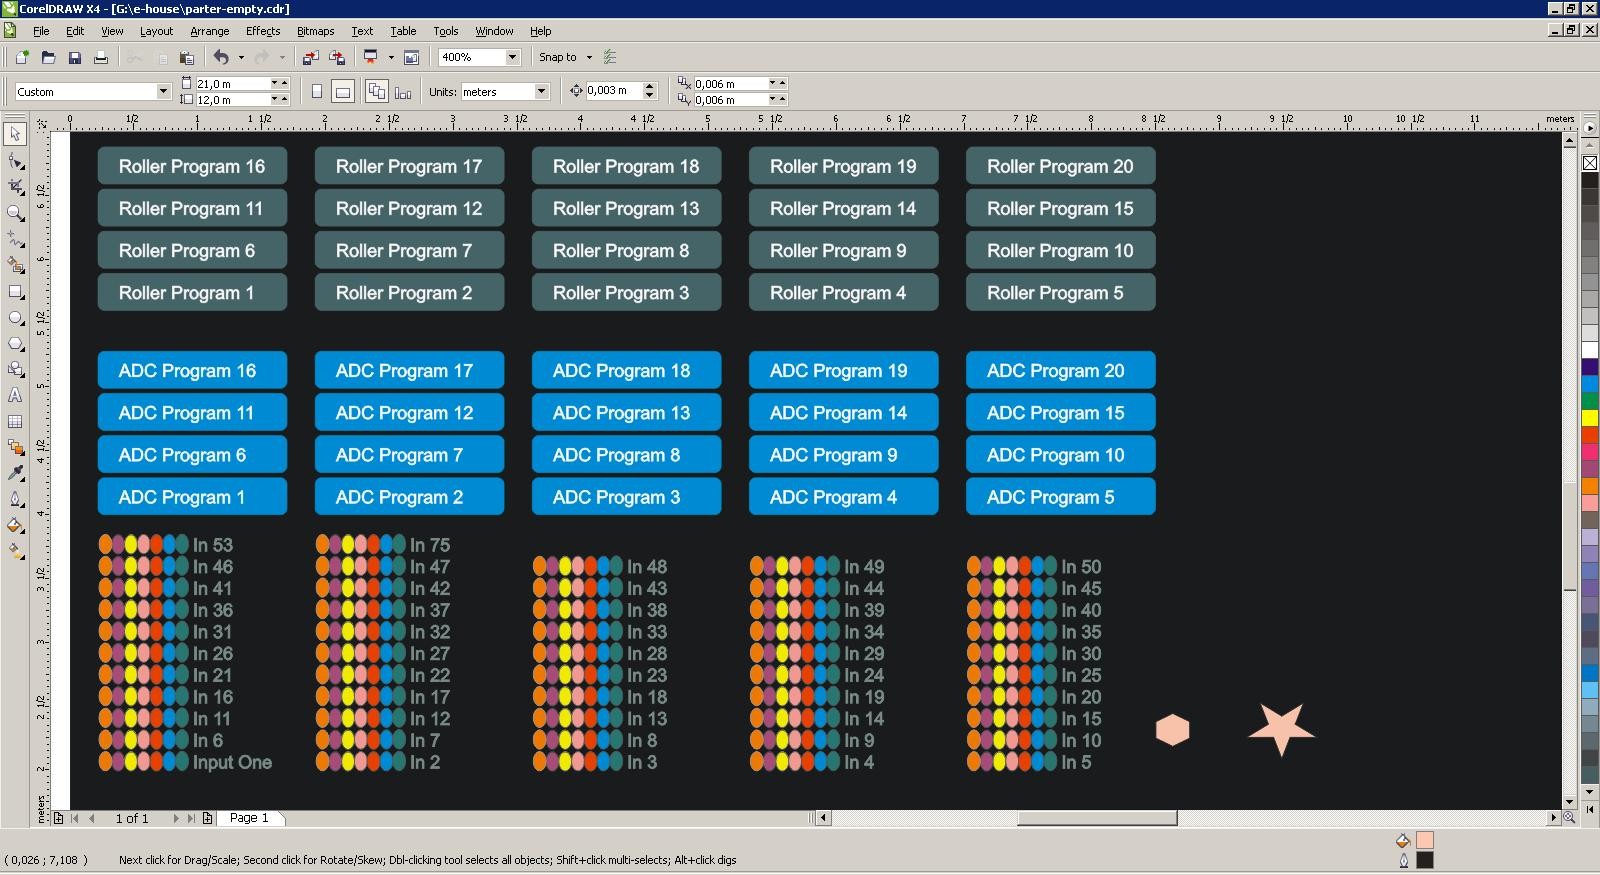
Automatically generated visualization of objects based on templates:
Effects in FireFox browser: